Showing posts with label Supply-Chain-Analytics. Show all posts

Visualizing Forecast Accuracy. When not to use the "start at zero" rule ?

I recently joined a discussion on Kaiser Fung's blog Junk Charts , When to use the start-at-zero rule concerning when charts should force a 0 into the Y-axis.  BTW - If you have not done so, add his blog to your RSS feed, it's superb and I have become a frequent visitor.

On this particular post, I would completely agree with his thoughts was it not for this one metric I have problems visualizing, Forecast Accuracy.

Recommended Reading: The Definitive Guide To Inventory Management

A little over 15 years go now, I was set the task to model how much inventory was needed for all of our, 3000 or so, products at every distribution center.  Prior to this point, inventory targets had been set at aggregate level based off experience and my management felt it was likely we had too much inventory in total and what we did have was probably not where it was most needed. (BTW - they were absolutely right and we were ultimately able to make substantial cuts in inventory while raising service levels).

I came to the project with a math degree, some programming expertise, practical experience simulating production lines, optimizing distribution networks, analyzing investments and with no real idea of how to get the job done.  The books I managed to get my hands on gave you some idea how to use such a system but no real idea how to build it.  They left out all the hard/useful bits I think.  So, I set about to work it out for myself with a lot of simulation models to validate that the outputs made sense.
Product Details
I still work occasionally in inventory modeling and I'll be teaching some components this fall, so I have been eagerly awaiting this new book : The Definitive Guide to Inventory Management: Principles and Strategies for the Efficient Flow of Inventory across... by CSCMP, Waller, Matthew A. and Esper, Terry L. (Mar 19, 2014)

Next-Generation DSRs (multi-retailer)

This post continues my look at the Next Generation DSR.  Demand Signal Repositories collect, clean,  report-on and analyze Point of Sale data to help CPGs drive increased revenues and reduce costs.

Most CPG implementations of a DSR support just one retailer's POS data.  OK before someone get's back to me with "but we have multiple retailers' POS data in our system", I'll clarify:
  • Having Walmart and Sam's Club data in the same DSR does not count (as the data comes from the same single source, RetailLink) and I bet you are still limited as to what you can report on across them.
  • If you have multiple-retailer's POS data set up in isolated databases using the same front-end... it does not count
  • If you have the data in the same database but without common data standards ... it does not count.
  • If you have the data in the same database but with no way to run analysis or reports across multiple retailers at once... it does not count.
So, yes, a number of CPGs have DSRs that support multi-retailer POS data sources, very, very few (if any?) have integrated that data into a single database with common data standards so they can report and analyze across multiple POS sources at the same time.

Does it matter?  I think so, multi-retailer ability opens up big opportunities around promotional-effectiveness,  assortment planning, supply-chain forecasting (demand sensing) and ease of use.

The right tools for (structured) BIG DATA handling - columnar, mpp and cloud - AWS Redshift

Today, I'm coming back a little closer to the series of promised posts on the Next Generation DSR to look at some benchmark results for the Amazon Redshift database.   Some time ago I wrote a couple of quite popular posts on using columnar databases and faster (solid state) storage to dramatically (4100%) improve the speed of aggregation queries against large data sets.  As data volumes even for ad-hoc analyses continue to grow though, I'm looking at other options.
Here's the scenario I've been working with: you are a business analyst charged with providing reporting and basic analytics on more data than you know how to handle - and you need to do it without the combined resources of your IT department being placed at your disposal.

Back to blogging on "Better Business Analytics"

It's been quite a while, just over 12 months in fact since my last blog post.  In that time, I've been hard at work developing analytic applications for the Orchestro DSR.  (Orchestro's off-shelf alerting tool is especially cool and something I am very proud of contributing to).    I enjoyed my time at Orchestro, they're a good team and have big plans, but one key thing I found out about myself is that I prefer working real-life problems to developing software for someone else to have all the fun :-)

So, I'm now back full-time on consulting and I will occasionally blog on topics of interest to me.   Expect to see more soon on:

  • Next-generations DSRs (Demand Signal Repositories)
  • Retail supply-chain analytics
  • Handling (BIG-ish) data for analytics
  • The right tools for the job (Predictive Analytics, Business Models, Optimization)
  • Some more thoughts on store-clustering
  • Inventory modeling at retail (and why it's different, again)
  • Order forecasting using POS data
  • Further thoughts on SNAP and other ignored demand drivers
  • and if there is something you would like to hear more on ... just drop me a line.


The right tools for (structured) BIG DATA handling

Here's the scenario: you are a business analyst charged with providing reporting and basic analytics on more data than you know how to handle - and you need to do it without the combined resources of your IT department being placed at your disposal.  Sounds familiar?

Let's use Point of Sale data as an example as POS data can easily  generates more data-volume than the ERP system.  The data is simple and easily organized in conventional relational database tables -  you have a number of "facts" (sales-revenue, sales-units, inventory,  etc.) defined by product, store and day going back a few years and then some additional information about products, stores and time stored in master ("dimension") tables,

The problem is that you have thousands of stores, thousands of products and hundreds (if not thousands) of days - this can very quickly feel like "big data".    Use the right tools and my rough benchmarks suggests you can not only handle the data but see a huge increase in speed.

Business Analytics - The Right Tools For The Job

Whether your analytic tool of choice is Excel or R or Access or SQL Server or ... whatever,  if you've worked a reasonable range of analytic problems I will guarantee that at some point you have tried to make your preferred tool do a job it is not intended for or that it is ill-suited for.  The end result is an error-prone, maintenance nightmare and there is a better way.

Recommended Reading: Supply Chain Network Design


I've done a lot of  supply chain network design projects and consider myself to be an expert. Had I had this book from the start, I may have got to expert status a lot faster.

With experience in supply-chain and an academic background that includes mathematical-optimization, when the need arose to build supply chain network optimization models I just did it.  Then I learned many, valuable, real-world lessons the hard way- by getting it wrong.

There are a number of books available that cover this area: I have dipped into a few, as needed, and I have not read most of them so I really can't say this is the best book available on the subject.  I can say this is one of the very few analytic books on any subject that I have read cover to cover.  

Ignore SNAP and your product may not be on the shelf when it's most needed - and that means lost sales.


SNAP is the “Supplemental Nutrition Assistance Program” (formerly known as “Food Stamps”) in the United States which puts food on the table for 46 million people every month. 

SNAP can drive big spikes in sales at the store. These spikes are large but short-lived and often pass undetected by reporting and forecasting systems.    

Our whitepaper covers the causes of SNAP spikes, why they vary so much across regions and products, how to identify sales spikes and what you should be doing to maximize sales.

Download it now or visit our website for more information.


SNAP Analytics (2) - Purchase Patterns

Roughly 15% of the United States population receives SNAP funding to help pay for food and beverage items.  We know that when SNAP (food stamp) funding is released in each state (see SNAP Analytics (1) - Funding and spikes)  this is accompanied by significant sales spikes on some products,

If 15% of all shoppers visit your store within a 2-3 day period you should see a sales spike on  everything they buy, SNAP funded or not . So, why do we not see a spike on everything?  Why are some spikes so much bigger than others?


SNAP Analytics (1) - Funding and spikes.

Back in August I took a quick look at SNAP, the US government's "Supplemental Nutritional Assistance Program", formerly known as "Food Stamps". (see What's driving your Sales? SNAP?).  

In 2011, approximately 15% of the US population received SNAP benefits that they can spend on most food and beverage items in store.  SNAP funding has doubled in the last 3 years.

SNAP can create large spikes in demand at the store and yet, because of the way these funds are distributed , this is typically hidden from analysts looking at aggregate data. (see Do you need daily Point of Sale data?... )

If you do not know which products, stores and dates will see spikes in demand how can you ensure product is on-shelf?  Ignoring SNAP may be costing you sales.

This is the first in a series of posts covering Analytics around SNAP and opportunities for driving incremental sales.

What's the biggest supply chain issue for CPG/Retail?

This morning I picked up a post for this blog from Visicom.  In summary
"We asked dozens of retail store managers this week: what’s the biggest issue you are having with product delivery by vendors? Know what they said? The biggest problem for most retailers is out of stock products."
Despite the low, probably unrepresentative sample size (dozens?) I think there is a ring of truth to this, but, is product delivery the biggest supply chain issue for CPG/Retail?  Not even close.

Truckload Transportation - are you paying to ship air ?


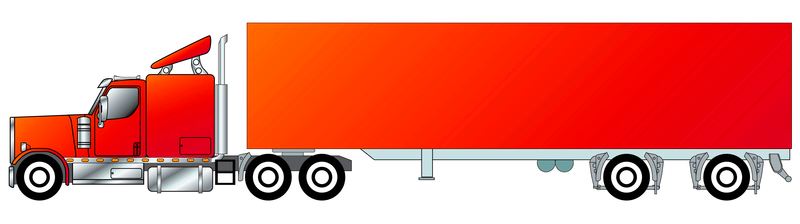
How full is a "full" truck?   Not sure?  That's a shame, because when you contract for truckload freight, you pay for the whole vehicle, whether you fill it or not.   As I'll show you, the regulations around what constitutes "full" for weight are very complex.  In addition, the 3D jigsaw puzzle to pack product into the trailer space, distributing weight correctly and minimizing damage is exceptionally challenging.  Get it wrong and you are paying to ship air.  

Do you need daily Point of Sale data? Do you like selling more product?

Most people report on their Point of Sale data in weekly or perhaps even monthly buckets .  If you are interested in seeing a long-term trend or annual seasonality that's OK, but if you really want to know what's going on, to ensure you have product on shelf, and promotions running when your target shoppers are in store - you need daily POS data.  Don't believe me?  Let's look at an example...

How to save real money in truckload freight (Part II)


In the first post in this series (Part I) I looked at the opportunities to reduce freight cost from traditional transportation management, but the really big opportunities may lie outside of your transportation team's control.  In this post, we'll look at some additional (and very possibly larger) opportunities.

 By the time a request hits the Transportation Team the damage has been done.  It’s already been decided that something needs to move, how it needs to move and when it must depart/arrive.  This is where you can really save.

How to save real money in truckload freight (Part I)


How can you save real money in truckload transportation?   In this post, let’s look at the areas that your transportation team manages directly.

How much money can you save from a Transportation Procurement Rate-Bid?

How much money can you really save from a transportation procurement bid? Probably not as much as you might like, but enough to pay for the bid with a good return.

I recently returned from the CSCMP conference in Atlanta where I attended a great session, jointly presented by folks from C.H. Robinson and researchers from Iowa State University.  They have taken a very similar statistical modeling approach to the one I covered in a recent post [..the challenge of transportation rates] to answer questions around the impact of transportation bids and this result is in the public domain. 

Supply Chain Network Optimization: the challenge of transportation rates

Supply Chain Network Optimization can yield major savings but getting clean data to model with (particularly transportation rates) is a major challenge.

Order Optimization: Smaller (standard) order quantities, more full-pallet orders AND reduced retailer inventory

If you work in the Supply Chain between CPG and Retail this probably sounds too good to be true, but stick with me and I'll show you a win:win opportunity.

Inventory modeling is not "Normal"

We can build models to know how much inventory we need to hold of each product in each location. Do this well and you improve service levels AND reduce inventory.   I've posted on this topic before including an online calculator from a relatively simple Excel model to help you visualize the relationship between uncertainty, lead-time and case-fill rate. (Check out How much Inventory do you really need ?).

I wrapped up that post with a warning/disclaimer that the spreadsheet model was really too simple for real life use, but I didn't tell you why.  Now here's the kicker:  many packages appear to have the same problem and can cause you to severely underestimate your inventory needs and lose sales.