If 15% of all shoppers visit your store within a 2-3 day period you should see a sales spike on everything they buy, SNAP funded or not . So, why do we not see a spike on everything? Why are some spikes so much bigger than others?

Business Analytics and Predictive Modeling for CPG/Retail
SNAP Analytics (2) - Purchase Patterns
Roughly 15% of the United States population receives SNAP funding to help pay for food and beverage items. We know that when SNAP (food stamp) funding is released in each state (see SNAP Analytics (1) - Funding and spikes) this is accompanied by significant sales spikes on some products,
If 15% of all shoppers visit your store within a 2-3 day period you should see a sales spike on everything they buy, SNAP funded or not . So, why do we not see a spike on everything? Why are some spikes so much bigger than others?
If 15% of all shoppers visit your store within a 2-3 day period you should see a sales spike on everything they buy, SNAP funded or not . So, why do we not see a spike on everything? Why are some spikes so much bigger than others?

SNAP Analytics (1) - Funding and spikes.
Back in August I took a quick look at SNAP, the US government's "Supplemental Nutritional Assistance Program", formerly known as "Food Stamps". (see What's driving your Sales? SNAP?).
In 2011, approximately 15% of the US population received SNAP benefits that they can spend on most food and beverage items in store. SNAP funding has doubled in the last 3 years.
SNAP can create large spikes in demand at the store and yet, because of the way these funds are distributed , this is typically hidden from analysts looking at aggregate data. (see Do you need daily Point of Sale data?... )
If you do not know which products, stores and dates will see spikes in demand how can you ensure product is on-shelf? Ignoring SNAP may be costing you sales.
This is the first in a series of posts covering Analytics around SNAP and opportunities for driving incremental sales.
In 2011, approximately 15% of the US population received SNAP benefits that they can spend on most food and beverage items in store. SNAP funding has doubled in the last 3 years.
SNAP can create large spikes in demand at the store and yet, because of the way these funds are distributed , this is typically hidden from analysts looking at aggregate data. (see Do you need daily Point of Sale data?... )
If you do not know which products, stores and dates will see spikes in demand how can you ensure product is on-shelf? Ignoring SNAP may be costing you sales.
This is the first in a series of posts covering Analytics around SNAP and opportunities for driving incremental sales.
What's the biggest supply chain issue for CPG/Retail?
This morning I picked up a post for this blog from Visicom. In summary
"We asked dozens of retail store managers this week: what’s the biggest issue you are having with product delivery by vendors? Know what they said? The biggest problem for most retailers is out of stock products."Despite the low, probably unrepresentative sample size (dozens?) I think there is a ring of truth to this, but, is product delivery the biggest supply chain issue for CPG/Retail? Not even close.
Better Business Reporting in Excel - XLReportGrids 1.0 released
XLReportGrids 1.0 released

XLReportGrids is a FREE, Excel add-in that builds grids of visual reports, from a template, sized to fit the printed page.
Templates are just a range of cells in a worksheet that are driven by a pivot-table. Build templates with: charts, formulas, images, pivot-tables, text boxes, anything that can be added to a worksheet.

Truckload Transportation - are you paying to ship air ?
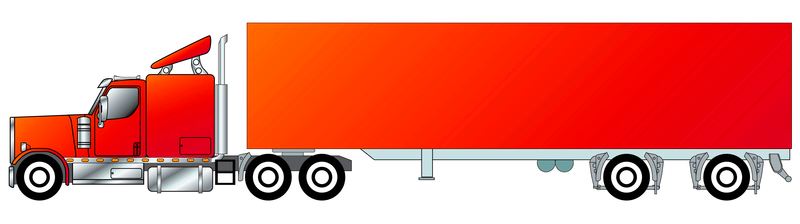
How full is a "full" truck? Not sure? That's a shame, because when you contract for truckload freight, you pay for the whole vehicle, whether you fill it or not. As I'll show you, the regulations around what constitutes "full" for weight are very complex. In addition, the 3D jigsaw puzzle to pack product into the trailer space, distributing weight correctly and minimizing damage is exceptionally challenging. Get it wrong and you are paying to ship air.
Do you need daily Point of Sale data? Do you like selling more product?
Most people report on their Point of Sale data in weekly or perhaps even monthly buckets . If you are interested in seeing a long-term trend or annual seasonality that's OK, but if you really want to know what's going on, to ensure you have product on shelf, and promotions running when your target shoppers are in store - you need daily POS data. Don't believe me? Let's look at an example...
Subscribe to:
Posts (Atom)