Better Point of Sale Reports with "Variance Analysis": Velocity, Distribution and Pricing.. oh my !
Routine, weekly point-of-sale reports tend to look very similar. For various time buckets (Last week, last 4 weeks, year to date) we total sales in both currency and units then compare to prior year. Add in a few more measures to look at retail pricing, inventory, or service level metrics and you may struggle to make it fit on a page. And from a CPG standpoint, POS reporting is only half of the story: a CPG's sales targets are not based on POS, they are based on shipments to the retailer. How can you get a good overview of POS and reconcile that with Shipments all in one report?

Business Analytics and Predictive Modeling for CPG/Retail
Better Point of Sale Reports with Variance Analysis (update)
I've just revised and updated one of the most popular posts on this blog adding more detailed descriptions, a graphical view to the output and more clearly showing path to action based on these reports. Follow the link below to the updated post.
Better Business Analytics - Christmas list

With just a few days left before the holiday season hits I wanted to do something a little more fun, so I've pulled together a list of things that I think every Business Analyst should want. Some are free to acquire, just costing your time to learn, others you may wish to ask Santa (or your CFO) to provide.
SNAP Analytics (2) - Purchase Patterns
Roughly 15% of the United States population receives SNAP funding to help pay for food and beverage items. We know that when SNAP (food stamp) funding is released in each state (see SNAP Analytics (1) - Funding and spikes) this is accompanied by significant sales spikes on some products,
If 15% of all shoppers visit your store within a 2-3 day period you should see a sales spike on everything they buy, SNAP funded or not . So, why do we not see a spike on everything? Why are some spikes so much bigger than others?
If 15% of all shoppers visit your store within a 2-3 day period you should see a sales spike on everything they buy, SNAP funded or not . So, why do we not see a spike on everything? Why are some spikes so much bigger than others?
SNAP Analytics (1) - Funding and spikes.
Back in August I took a quick look at SNAP, the US government's "Supplemental Nutritional Assistance Program", formerly known as "Food Stamps". (see What's driving your Sales? SNAP?).
In 2011, approximately 15% of the US population received SNAP benefits that they can spend on most food and beverage items in store. SNAP funding has doubled in the last 3 years.
SNAP can create large spikes in demand at the store and yet, because of the way these funds are distributed , this is typically hidden from analysts looking at aggregate data. (see Do you need daily Point of Sale data?... )
If you do not know which products, stores and dates will see spikes in demand how can you ensure product is on-shelf? Ignoring SNAP may be costing you sales.
This is the first in a series of posts covering Analytics around SNAP and opportunities for driving incremental sales.
What's the biggest supply chain issue for CPG/Retail?
This morning I picked up a post for this blog from Visicom. In summary
"We asked dozens of retail store managers this week: what’s the biggest issue you are having with product delivery by vendors? Know what they said? The biggest problem for most retailers is out of stock products."Despite the low, probably unrepresentative sample size (dozens?) I think there is a ring of truth to this, but, is product delivery the biggest supply chain issue for CPG/Retail? Not even close.
Better Business Reporting in Excel - XLReportGrids 1.0 released
XLReportGrids 1.0 released

XLReportGrids is a FREE, Excel add-in that builds grids of visual reports, from a template, sized to fit the printed page.
Templates are just a range of cells in a worksheet that are driven by a pivot-table. Build templates with: charts, formulas, images, pivot-tables, text boxes, anything that can be added to a worksheet.

Truckload Transportation - are you paying to ship air ?
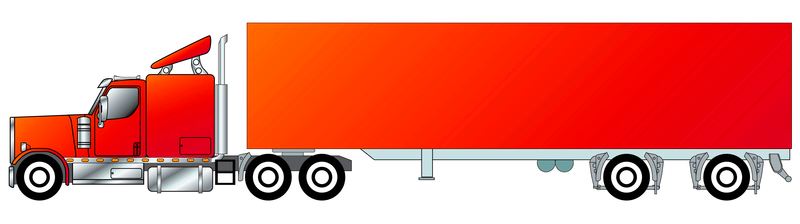
How full is a "full" truck? Not sure? That's a shame, because when you contract for truckload freight, you pay for the whole vehicle, whether you fill it or not. As I'll show you, the regulations around what constitutes "full" for weight are very complex. In addition, the 3D jigsaw puzzle to pack product into the trailer space, distributing weight correctly and minimizing damage is exceptionally challenging. Get it wrong and you are paying to ship air.
Do you need daily Point of Sale data? Do you like selling more product?
Most people report on their Point of Sale data in weekly or perhaps even monthly buckets . If you are interested in seeing a long-term trend or annual seasonality that's OK, but if you really want to know what's going on, to ensure you have product on shelf, and promotions running when your target shoppers are in store - you need daily POS data. Don't believe me? Let's look at an example...
Better Point of Sale Reports with "Variance Analysis": Velocity, Distribution and Pricing.. oh my !
How to save real money in truckload freight (Part II)
In the first post in this series (Part I) I looked at the opportunities to reduce freight cost from traditional transportation management, but the really big opportunities may lie outside of your transportation team's control. In this post, we'll look at some additional (and very possibly larger) opportunities.
By the time a request hits the Transportation Team the damage has been done. It’s already been decided that something needs to move, how it needs to move and when it must depart/arrive. This is where you can really save.
How to save real money in truckload freight (Part I)
How can you save real money in truckload
transportation? In this post, let’s look at the areas that your transportation team manages directly.
How much money can you save from a Transportation Procurement Rate-Bid?
How much money can you really save from a transportation procurement bid? Probably not as much as you might like, but enough to pay for the bid with a good return.
I recently returned from the CSCMP conference in Atlanta where I attended a great session, jointly presented by folks from
C.H. Robinson and researchers from Iowa State University. They have taken a very similar statistical modeling approach to the one I covered in a recent post [..the challenge of transportation rates] to answer questions around the impact of
transportation bids and this result is in the public
domain.
Supply Chain Network Optimization: the challenge of transportation rates
Supply Chain Network Optimization can yield major savings but getting clean data to model with (particularly transportation rates) is a major challenge.
Order Optimization: Smaller (standard) order quantities, more full-pallet orders AND reduced retailer inventory
If you work in the Supply Chain between CPG and Retail this probably sounds too good to be true, but stick with me and I'll show you a win:win opportunity.
Inventory modeling is not "Normal"
We can build models to
know how much inventory we need to hold of each product in each location. Do
this well and you improve service levels AND reduce inventory. I've
posted on this topic before including an online calculator from a relatively simple
Excel model to help you visualize the relationship between uncertainty,
lead-time and case-fill rate. (Check out How much
Inventory do you really need ?).
Inventory modeling in action
Inventory modeling and inventory optimization attempt to drive out unnecessary inventory from your systems, to improve service levels to your customers. This does work and can drive very significant reductions in inventory, but, if you lack discipline around execution you will not get as much value as you should.
What's driving your Sales? SNAP?
 |
SNAP is the “Supplemental Nutrition Assistance Program” (formerly known as “Food Stamps”) in the United States. . “We put healthy food on the table for more than 46 million people each month.” http://www.fns.usda.gov/snap/ Could this be driving spikes in your sales? If you are involved with food/beverage sales in the United States, very possibly, it could. SNAP sales spikes can be large and short-lived. Ignore SNAP and your product may not be available on the shelf when it's needed, losing sales opportunities. |
Balancing safety-stocks across DCs
Earlier today I saw and responded to a question posted on the IBF (Institute of Business Forecasting & Planning) LinkedIn Group. It's a question I come across often so I thought I would repost it here (with a few edits).
Question:
How do I go about preparing an aged inventory analysis? I need to show fast moving,slow moving item, then I want to transfer product with in DC's that are slow so that the amount of SS is balance
Question:
How do I go about preparing an aged inventory analysis? I need to show fast moving,slow moving item, then I want to transfer product with in DC's that are slow so that the amount of SS is balance
Clustering with a destination in mind
I've posted before on Cluster Analysis, in an attempt to demystify one of the more accessible and useful analytical approaches for CPG/Retail teams (see Cluster Analysis - 101) .
Finding groups of similar stores (for example) can be a very effective way to manage the complexity of offering each store group what they really need without having to deal with each one individually, a mammoth task. Whether you are looking to find groups of stores, shoppers, regions, products or even sales patterns a very similar approach can work for you.
Clustering is part of the journey it's not a destination. If you don't know and understand what decisions your analytic work should enable (your destination) how can you build a good model?
Better Business Reporting in Excel - XLReportGrids beta released
In my last Blog entry, I talked about reporting in Excel, some of the reasons I choose to make heavy use of them, and some of the issues that stop me using them even more. (see Better Business Reporting in Excel)
- Pivot-tables can only show you data (although lots of it)
- Pivot-charts show you a chart, but only 1 per pivot-table
- If you want the same report for multiple grouping (e.g months, years, brands or locations) you add these groups to your pivot-table and select them one at a time to print.
XLReportGrids is a free Excel add-in, now available in beta test, that builds grids of reports with multiple copies of a template sized to fit the page. Templates are just a range of cells in a worksheet that are driven by a pivot-table. Build templates with: charts, formulas, images, pivot-tables, text boxes, anything that can be added to a worksheet.
Better Business Reporting in Excel
What do you think is the most-used reporting tool in the world? There are a lot of them available, at times it can be hard to move without running into a new Business Intelligence (BI) tool, but I'm going to hazard a guess with a high degree of confidence that the most used tool is still Excel.
Excel may not be where the data originated from and there may well have been a database involved to crunch numbers and aggregate to the point that the data would fit comfortably in Excel, but I do believe that it's still the most widely used tool for final 'analysis' and presentation of data.
This is not because Excel is the best tool for the job as almost every feature of Excel is handled better by another tool. Joining separate tables of data with Lookup functions is a very pale shadow of using a properly defined database and the SQL language. There are substantially better graphics, charting and visualization tools available. The analysis tools (Correlation, Regression, ANOVA, Linear-programming) are the poor relation to more industrial strength packages.
WARNING: Bad business analytics may be hazardous to your wealth !
You paid handsomely for the software, perhaps for consulting too and have had some bright sparks working on it for months: the results of your analytics project are in and the answer is ... useless without some understanding of how good the models are it's built on. If the analyst cannot give you detail on how 'good" the model is for its purpose, all results should come with a wealth warning.
BAD BUSINESS ANALYTICS MAY BE HAZARDOUS TO YOUR WEALTH.
Point of Sale Data – Supply Chain Analytics
I’ve spent a large part of my career working in Analytics
for Supply Chain. It’s an area blessed
with a lot of data and I’ve been able to use predictive analytics and
optimization very successfully to drive cost out of the system. Much of what I learned in managing CPG supply
chains translates directly to Retailer supply chains it’s just that there is much more data to deal with.
Point of Sale Data – Category Analytics
If you haven’t already read the previous entries in this
series, you may want to go back and check out [Point of Sale Data – the basics]
to see why you really need a DSR to handle this data, and [Point of Sale Data – Sales Analytics] for some thoughts on analyzing sales drivers
that are equally relevant to Category Management,
Point of Sale Data – Sales Analytics
I’m assuming that you now have a DSR (see [Point Of Sale Data - Basic Analytics] ) so you can manipulate the large quantities of data
necessary to do this work, you have your routine reports automated and use the
DSR for ad-hoc queries against the POS data.
The DSR provides a great foundation for analytic work: use
it to integrate multiple data sources, clean the data, handle very large data volumes as though it was
all sat on your desktop and it will help you build reports that summarize that
history with ease. Typically, the DSR does not provide much help for you with
predictive-analytics.
Let’s look at an example related to what really drives
sales. Do you know?
Can you quantify it? Knowing
these answers with quantified detail can help you better explain your sales
history and plan for the future. Better
promotions, better pricing, supply chains that anticipate peaks in demand and
make sure the product is on the shelf when it’s needed. Here are some of the things that could drive
your sales:
Point of Sale Data – Basic Analytics
You've got access to Point of Sale Data…now, what are you
going to do with it?
For the purpose of this blog entry, I’m assuming that we
have daily aggregated data by product
and by store. We will certainly get
measures of sales (both units sold and currency received). We may also get other useful measures like
inventory on-hand, inventory in-transit, store-receipts, mark-downs taken at
the store and perhaps some data around warehouse activity too.
Is the juice worth the squeeze?
I have heard this phrase a lot in recent months in a business
context. It’s so visual, I love it!
It’s not quite enough though. It’s pretty simple to understand that every
project must be able to pay for itself and deliver a return. Is the juice worth the squeeze?
It’s also true though that no organization has infinite
resources of time or money. If you have
10 projects that you could do but only enough resources to handle 3, you must
prioritize those projects that help you meet your objectives (growth,
profitability, market share). What
has the most bang for the buck?
So with these 2 phrases in mind, it should now be
easy…right? (Can you hear the sarcasm)?
How much inventory do you really need?
If you are following lean methodologies you will have
encountered the concept of inventory as waste.
It’s something you have because you cannot instantly manufacture and
deliver your product to a shopper when they want it, but not something that the
shopper sees any value in.
I find that a very interesting idea as it challenges the reasons that you need inventory, and that’s definitely worthwhile. However, many of these causes of inventory need more substantial changes in your supply chain (additional production capacity, shorter set-up times, multiple production locations) so as a first step, I suggest that you figure out what inventory your supply chain really needs and why. Take out the truly wasted, unnecessary stock and then see what structural changes make sense.
Typically you can remove at least 10% of inventory while improving product availability. What’s that worth to you? If that sounds a little aggressive, I can only say “been there, done that, got the coffee-mug”. (We didn’t do t-shirts).
Are pie-charts evil or just misunderstood ?
OK - I admit it: when I see a pie-chart in business analytics, my blood pressure rises and, yes, I am apt to tell the analyst exactly what I think of the monstrous, hard to read, waste of space and ink they created.
I am most definitely NOT the first person to suggest that pie-charts are over used and close to useless. Google 'Pie Charts are Evil' and see for yourself. This is an area where career analysts tend to agree, yet, in practice, pie-charts are very, very heavily (ab)used. In the hope that I can influence even a handful of people to create fewer of these eyesores I'm adding my voice to the argument.
I am most definitely NOT the first person to suggest that pie-charts are over used and close to useless. Google 'Pie Charts are Evil' and see for yourself. This is an area where career analysts tend to agree, yet, in practice, pie-charts are very, very heavily (ab)used. In the hope that I can influence even a handful of people to create fewer of these eyesores I'm adding my voice to the argument.
Analytic tools "so easy a 10 year-old can use it"
If
you search the web you'll find lots of analytic tools to support your business:
tools to help with forecasting, inventory optimization, risk analysis,
simulation for production lines and warehouses, production scheduling,
supply-chain network design, vehicle loading, price-sensitivity modeling and
planogram building - and that is very, very far from being an exhaustive list.
Some
of these tools are bought as a service that includes expertise to prepare your
data, do the modeling work for you and configure the system to meet your needs.
These tools will be much more expensive than the 'roll your own' variety and
the more frequently that expertise is required, the more you will pay.
The Primary Analytics Practitioner
The field of Business Analytics can be very complex. Top level
analysts are experts; just like medical specialists, they have undergone years
of additional training and know their area of specialty (perhaps price
sensitivity, multivariate statistical modeling, survey analysis or mathematical
optimization) backwards. Keeping with this analogy, most business managers are as well informed as
to what business analytics can do for them as a patient heading in to see their
primary physician; perhaps less so.
Bringing your analytical guns to bear on Big Data – in-database analytics
I've blogged before about the need to use the right tools to hold and
manipulate data as data quantity increases (Data Handling the Right Tool for the Job). But, I really want to get to some value-enhancing analytics and as data grows it becomes increasingly hard to
apply analytical tools.
Let’s assume that we have a few Terabytes of data and that it's sat in an industrial-strength
database (Oracle, SQL*Server, MySQL, DB2, …) - one that can handle the data
volume without choking. Each of these databases has its own dialect of the querying
language (SQL) and while you can do a lot of sophisticated data manipulation, even a simple analytical routine like calculating correlations is a chore.
Cluster Analysis - 101
The current Wikipedia page on Cluster Analysis, excerpted below, is correct, detailed and makes absolute sense. Then again, if you do not have a background in statistical modeling, I'm guessing these two paragraphs leave you no wiser.
Cluster analysis or clustering is the task of assigning a set of objects into groups (called clusters) so that the objects in the same cluster are more similar (in some sense or another) to each other than to those in other clusters.
Clustering is a main task of explorative data mining, and a common technique for statistical data analysis used in many fields, including machine learning, pattern recognition, image analysis, information retrieval, and bioinformatics.
Wikipedia 4/2012
In this post I hope to provide a workable introduction for people that need to be educated consumers of cluster analysis.
Reporting is NOT Analytics
Reporting is about what happened; Analytics is about answering "what if" and "what's best" questions. Most of the materials that land on
a VP/Director’s desk (or inbox) are examples of reporting with no analytical
value added.
Data handling - the right tool for the job
Microsoft Excel must be the most
widely used analytic tool available today but, it’s not the only tool in my tool-bag and it should not be the only one in yours either.
It’s perfect for building small models, has broad embedded functionality, good charting capabilities, pivot-tables (a
superb tool worthy of its own post), comes with a programming language so
you can extend its capability even further and almost everybody has a copy already.
It’s awesome and I use it every day.
But...the data we analyze is getting much bigger and a lot more complex.
Even with newer versions of Excel allowing over 1 million records in a sheet, what can you do usefully in Excel with 1 million records? Certainly, you don’t want to print it, it’s
near impossible to chart or model against, bottom line you are using the wrong
tool for the job. To do the job well you
need to find, learn and use the right tool.
Don’t believe me? Try chopping
down a tree with a hammer!
Data Cleansing: boring, painful, tedious and very, very important
I've been working recently on a category management project and I'm reminded of just how essential clean, well-organized data is. We are working to group stores into 'clusters' of similar stores; later we will see what geographic and demographic data best helps us to predict cluster membership and optimize product assortment by cluster.
As a first pass, and under a severe time crunch, we took the data available, ran it through the model and while it processed, I was unhappy with the predictive power we found. Of course, this approach was ridiculously optimistic: so, back to look at the product characteristics we were using.
As a first pass, and under a severe time crunch, we took the data available, ran it through the model and while it processed, I was unhappy with the predictive power we found. Of course, this approach was ridiculously optimistic: so, back to look at the product characteristics we were using.
What is ‘analysis’ and why do most ‘analysts’ not do it?
In the Consumer Product Goods (CPG) world, there are a lot of analysts: supply chain analysts; sales analysts; shelf analysts; category analysts; transportation analysts... you get the idea. For many people the 'analyst' role is their first step onto the managerial ladder. It is their job to learn the business, 'crunch' numbers and one day, with hard work and a little luck, get promoted to a non-analytic, managerial role.
Subscribe to:
Posts (Atom)